Hi DSP’ers,
Hope you are safe and fine!
Today, we are going to learn about the new AUTOML framework called evalml which is created by the very famous company in analytics field “Alteryx”.
EvalML is an AutoML library which builds, optimizes, and evaluates machine learning pipelines using domain-specific objective functions
Key Functionality
- Automation – Makes machine learning easier. Avoid training and tuning models by hand. Includes data quality checks, cross-validation and more.
- Data Checks – Catches and warns of problems with your data and problem setup before modeling.
- End-to-end – Constructs and optimizes pipelines that include state-of-the-art preprocessing, feature engineering, feature selection, and a variety of modeling techniques.
- Model Understanding – Provides tools to understand and introspect on models, to learn how they’ll behave in your problem domain.
- Domain-specific – Includes repository of domain-specific objective functions and an interface to define your own.
How to Install :
pip install evalml
!pip install evalml
We are going to use Bike sharing dataset from UCI machine learning for regression analysis
Dataset information:
– instant: record index
– dteday : date
– season : season (1:winter, 2:spring, 3:summer, 4:fall)
– yr : year (0: 2011, 1:2012)
– mnth : month ( 1 to 12)
– hr : hour (0 to 23)
– holiday : weather day is holiday or not (extracted from [Web Link])
– weekday : day of the week
– workingday : if day is neither weekend nor holiday is 1, otherwise is 0.
+ weathersit :
– 1: Clear, Few clouds, Partly cloudy, Partly cloudy
– 2: Mist + Cloudy, Mist + Broken clouds, Mist + Few clouds, Mist
– 3: Light Snow, Light Rain + Thunderstorm + Scattered clouds, Light Rain + Scattered clouds
– 4: Heavy Rain + Ice Pallets + Thunderstorm + Mist, Snow + Fog
– temp : Normalized temperature in Celsius. The values are derived via (t-t_min)/(t_max-t_min), t_min=-8, t_max=+39 (only in hourly scale)
– atemp: Normalized feeling temperature in Celsius. The values are derived via (t-t_min)/(t_max-t_min), t_min=-16, t_max=+50 (only in hourly scale)
– hum: Normalized humidity. The values are divided to 100 (max)
– windspeed: Normalized wind speed. The values are divided to 67 (max)
– casual: count of casual users
– registered: count of registered users
– cnt: count of total rental bikes including both casual and registered
Let’s read the file
import pandas as pd

data = pd.read_csv('hour.csv')

data.head()
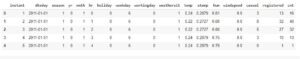
We are going to drop the features ‘instant’ and ‘dteday’ which are not going to be useful for the regression analysis.
data= data.drop(['instant','dteday'],axis=1)
Lets create different variable for independent and dependent variable . Here cnt(count of bicycle rented ) is the target variable
X=data.drop('cnt',axis=1)

y=data['cnt']
Now, import our evalml library, and we will split the data into 70:30 split.
In evalml you need to provide the problem_type so for us right now it is a regression problem.
import evalml

X_train,X_test,y_train,y_test = evalml.preprocessing.split_data(X,y,problem_type='regression',test_size=.3)
To check all the available machine learning algorithms in evalml. We need to type
evalml.problem_types.ProblemTypes.all_problem_types
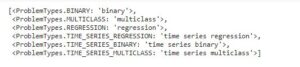
Evalml has binary classification, multi class classification, regression, time series regression, time series binary and time series multi class classification models.
With the help of automlsearch we will search for the best algorithm for our problem statement. Here also we need to provide the problem _type.
We will take max_batches as 1 to run all the models once with 3 CV(cross validation).
from evalml.automl import AutoMLSearch
automl = AutoMLSearch(X_train=X_train,y_train=y_train,problem_type='regression',max_batches=1,optimize_thresholds=True)
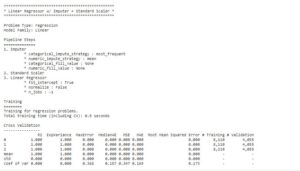
automl.search()
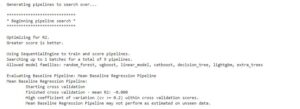
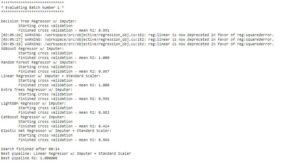
From the image we can see it has run 7 ML models on our regression analysis problem and out of which linear regression with imputation and standard scalar transformation is the best model.
This model is providing an adjusted R square score of 1 on the training data. (in the real world this is not possible, but our data is very much simple in nature)
We can also find out best models by ranking
automl.rankings
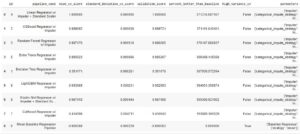
From the above code it will tell us the best model with all the performance metrics like.
- Mean CV score which is the average R2 score out of all the CV iterations.
- Standard deviation in all CV iterations.
- Validation score – It will try to fit the data on a y_train dataset of the training data.
- High variance CV- it will tell whether our model is over fitting or not?
- Parameters – it will provide us all the hyperparameters used in the best model. Which can help us to explain the model to the end users.
Now save this model as best pipeline which will automatically select the best model
best_pipeline = automl.best_pipeline
best model parameters are :- you can see imputation strategy is most frequent values for categorical column, for numerical columns its mean. Also, evalml has normalized the data while training
GeneratedPipeline(parameters={'Imputer':{'categorical_impute_strategy': 'most_frequent', 'numeric_impute_strategy': 'mean', 'categorical_fill_value': None, 'numeric_fill_value': None}, 'Linear Regressor':{'fit_intercept': True, 'normalize': False, 'n_jobs': -1},})
Also, if we want to see the complete description of the best model we can also do it using evalml
automl.describe_pipeline(automl.rankings.iloc[0]["id"])
To find out performance of the model we can find out using.
Here also, we need to specify the objective is the regression analysis.
scores = best_pipeline.score(X_test, y_test, objectives=evalml.objectives.get_core_objectives('regression'))
print(f'Accuracy regression: {scores["MAE"]:.10f}')
We can also check the performance metrics scores
scores
Now,lets predict on the test dataset. Evalml has function called pipeline.predict which will predict the test dataset.
pipeline = automl.best_pipeline
prediction = pipeline.predict(X_test)
once the prediction is done we can not directly use it as pandas dataframe as it has a type woodwork.datacolumn.DataColumn which is an alteryx data type.
Hence, we need to convert it to pandas series to append the result or if we want to find out the confusion matrix of the data for classification task
type(prediction)
woodwork.datacolumn.DataColumn
we will convert the prediction to pandas series
output = prediction.to_series()
output
now this output can be appended to your original dataset and also can be used to find performance matrix of the model
lets find out r square using sklearn metrics
from sklearn.metrics import r2_score

r2_score(y_test.to_series(), output)

output
output = 1.0 ( this is a very simple data with linear relationships)
Lastly, we can save the model to be used for later use
best_pipeline.save("model.pkl")
this PKL(pickle) file can be loaded later for the prediction part.
How to load the model file
mymodel = automl.load('model.pkl')
if we have a new test data we can predict it using.
mymodel.predict(X_test)
Comparison with Pycaret :-
Personally using Pycaret has higher number of models available compared to evalml. Pycaret also has GPU support. But evalml has good pipeline and explanation of parameters used in the model .Evalml is also faster compared to pycaret
Complete code can be found in my GitHub repo.
Reference and official GitHub page for evalml
Click here for more blogs.
Follow on LinkedIN

 3
3